Juliana McMillan-Wilhoit
Disaster Response · Puerto Rico U.S. Army Corps of Engineers

After Hurricane Maria, the hardest problem was knowing what you didn’t know.

I deployed to Puerto Rico as GIS Team Lead after Hurricane Maria. The island had lost nearly all power. The federal response needed to know, in real time, what was energized and what wasn’t, across every transmission line, every substation, every circuit. I built the geospatial platform that put that picture together.

Puerto Rico GIS Team Lead (deployed) U.S. Army Corps of Engineers / Task Force Power Restoration ArcGIS Geospatial Platform Data Standards Federal Coordination Crisis Mapping Power Grid
Impact
8h → 30m
Daily crisis reporting on the power grid, automated
All levels
Products used at every level of federal government response, including the White House
1 platform
Single geospatial platform unifying data from multiple federal agencies
Commander’s Award
Received Commander’s Award for work on Task Force Power Restoration

Hurricane Maria made landfall in Puerto Rico on September 20, 2017, as a Category 4 hurricane. Nearly the entire island lost power: 3.4 million people. The power grid had been fragile before the storm. After, it was catastrophically damaged.

I deployed to Puerto Rico as GIS Team Lead with the U.S. Army Corps of Engineers’ Task Force Power Restoration. The mission: help restore power to the island as quickly as possible. My job: build the geospatial infrastructure that made the whole operation legible. What was energized? What wasn’t? Where were the crews? What had been completed and what was still down? Nobody had a clear picture of any of it when I arrived.

In a normal infrastructure project you start with data. In a disaster response, there wasn’t any data to start with.

The power grid data for Puerto Rico existed in fragments: different agencies had different pieces, in different formats, at different levels of accuracy. PREPA (the Puerto Rico Electric Power Authority) had some data. The Corps had some. Other federal agencies had more. None of it talked to each other.

My first task was establishing data standards so that information flowing in from multiple sources could actually be combined into a coherent picture. Then building the platform that displayed it, updated as crews reported back from the field.
“In disaster response, the map isn’t just a visualization. It’s the shared understanding that lets a thousand people coordinate. Getting it right matters.”
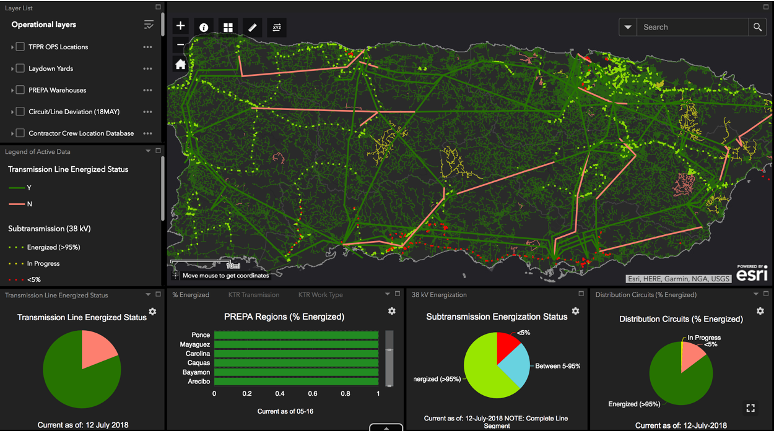
Geospatial platform for Task Force Power Restoration, integrating data from PREPA, Army Corps, and other federal agencies into a single unified view of the island’s power grid status
Data standards framework: established shared data standards so that information from multiple agencies and field crews could flow into the platform consistently and be combined
Real-time restoration tracking: transmission line energization status, subtransmission, distribution circuits, contractor crew locations, laydown yards, warehouse locations, all updated as the restoration progressed
Dashboard and visualization products: status maps and charts showing PREPA regions, energization percentages, work in progress, used at all levels of the federal response
Products briefed at the White House: the geospatial products developed by the team were used at the highest levels of the federal government response
Power restoration dashboard for Puerto Rico showing transmission line energization status across the island
Power restoration dashboard for Puerto Rico, July 2018. Transmission line energization status across the island (green = energized, red = not), with PREPA regional breakdowns and subtransmission status. Data current as of 12 July 2018. This type of product was used at all levels of the federal response.
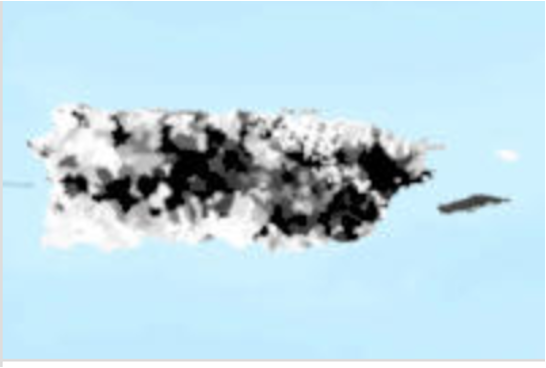
Land cover classification of Puerto Rico, grayscale analysis showing vegetation, urban areas, and terrain
Land cover classification of Puerto Rico, grayscale analysis showing vegetation, urban areas, and terrain. Used to understand the physical context of the power grid and infrastructure across the island.

Disaster response GIS is a different discipline from standard geospatial work. The data is incomplete and constantly changing. The decisions being made with your maps are high-stakes and time-sensitive. The people consuming your products are not GIS analysts. They’re commanders, logistics officers, federal officials.

The map has to be instantly legible to people who will look at it once and act on it. That discipline, making complex spatial data immediately usable for non-technical decision-makers, is something I carried back from Puerto Rico into every product I’ve built since.

Impact
The platform gave the federal response a shared picture of the island, updated in real time as power came back on.

By the time the mission wound down, Puerto Rico’s power grid restoration was trackable at every level, from individual distribution circuits to regional summaries to island-wide status. The products built by the team were used at every level of the federal government response, up to and including the White House.

The Commander’s Award recognized the team’s contribution. But what I carried away was something harder to put on a resume: the experience of building geospatial infrastructure under pressure, in an environment where the data didn’t exist yet, where the standards had to be established from scratch, and where getting it wrong had real consequences for people who were still without power.

Tools & Stack
ArcGIS Geospatial Platform Development Data Standards Federal Agency Coordination Real-Time Data Integration Crisis Mapping Power Grid Analysis Dashboard Design
Next project
After a wildfire, the clock starts. I built a tool to find the right parcels in hours, not days.
Post-Fire Recovery