Post-Disaster Site Selection · Reforestation
Tabulae Spatial Services / DroneSeed
After a wildfire, the clock starts. I built a tool to find the right parcels in hours, not days.
After a wildfire tears through an area, the window for reforestation is narrow. An organization contracting with DroneSeed needed to find candidate parcels fast: the right ownership type, the right tree cover loss, inside the fire boundary. Their process for doing that was slow and manual. I embedded with their geospatial team for six months and rebuilt it from scratch.
Western U.S. (multiple fire sites)
DroneSeed / reforestation organization
Embedded GIS consultant (6 months)
QGIS
Carto
QGIS Graphical Modeler
Parcel Analysis
Fire Boundary
Land Ownership
Listen
When a wildfire ends, the clock starts. Native tree cover that burned needs to be replanted before invasive species take hold. The window is measured in weeks, not years. An organization working with DroneSeed on post-fire reforestation needed to identify candidate parcels quickly after each fire event: parcels inside the fire perimeter, with significant tree cover loss, that were privately owned and reachable for outreach.
Their existing process for finding those parcels was slow, manual, and had to be rebuilt from scratch for each new fire. I was brought in to fix that.
Ask Why
I embedded with their geospatial team for six months, not as a consultant showing up with a proposal but as a working member of the team. I learned their data sources, their workflows, their constraints. What fire boundary data they had access to. How they obtained land ownership records. What the field crews actually needed on a candidate list before they could begin outreach.
The data existed. Pulling it together required a GIS analyst to manually run the same operations for every new fire, and that took time the mission didn't have.
"The goal was to build a tool the team could run themselves on the next fire, and the one after that."
Build
QGIS Graphical Modeler automation tool: packaged the entire site identification workflow into a single repeatable tool that could be run on any new fire event with minimal manual steps
Fire boundary integration: tool automatically intersected parcel data with fire perimeter boundaries to identify affected parcels
Tree cover loss analysis: incorporated satellite-derived tree cover loss data to score parcels by reforestation need
Land ownership filtering: integrated parcel ownership data to identify privately-held parcels accessible for outreach, distinguishing federal, state, and private land
Ranked candidate output: tool produced a scored, ranked spreadsheet of candidate parcels with owner name, contact address, parcel characteristics, and suitability score, ready for the outreach team to use immediately
Designed for non-technical users: the tool was built so less-technical members of the geospatial team could run it, modify parameters, and adapt it as needs evolved
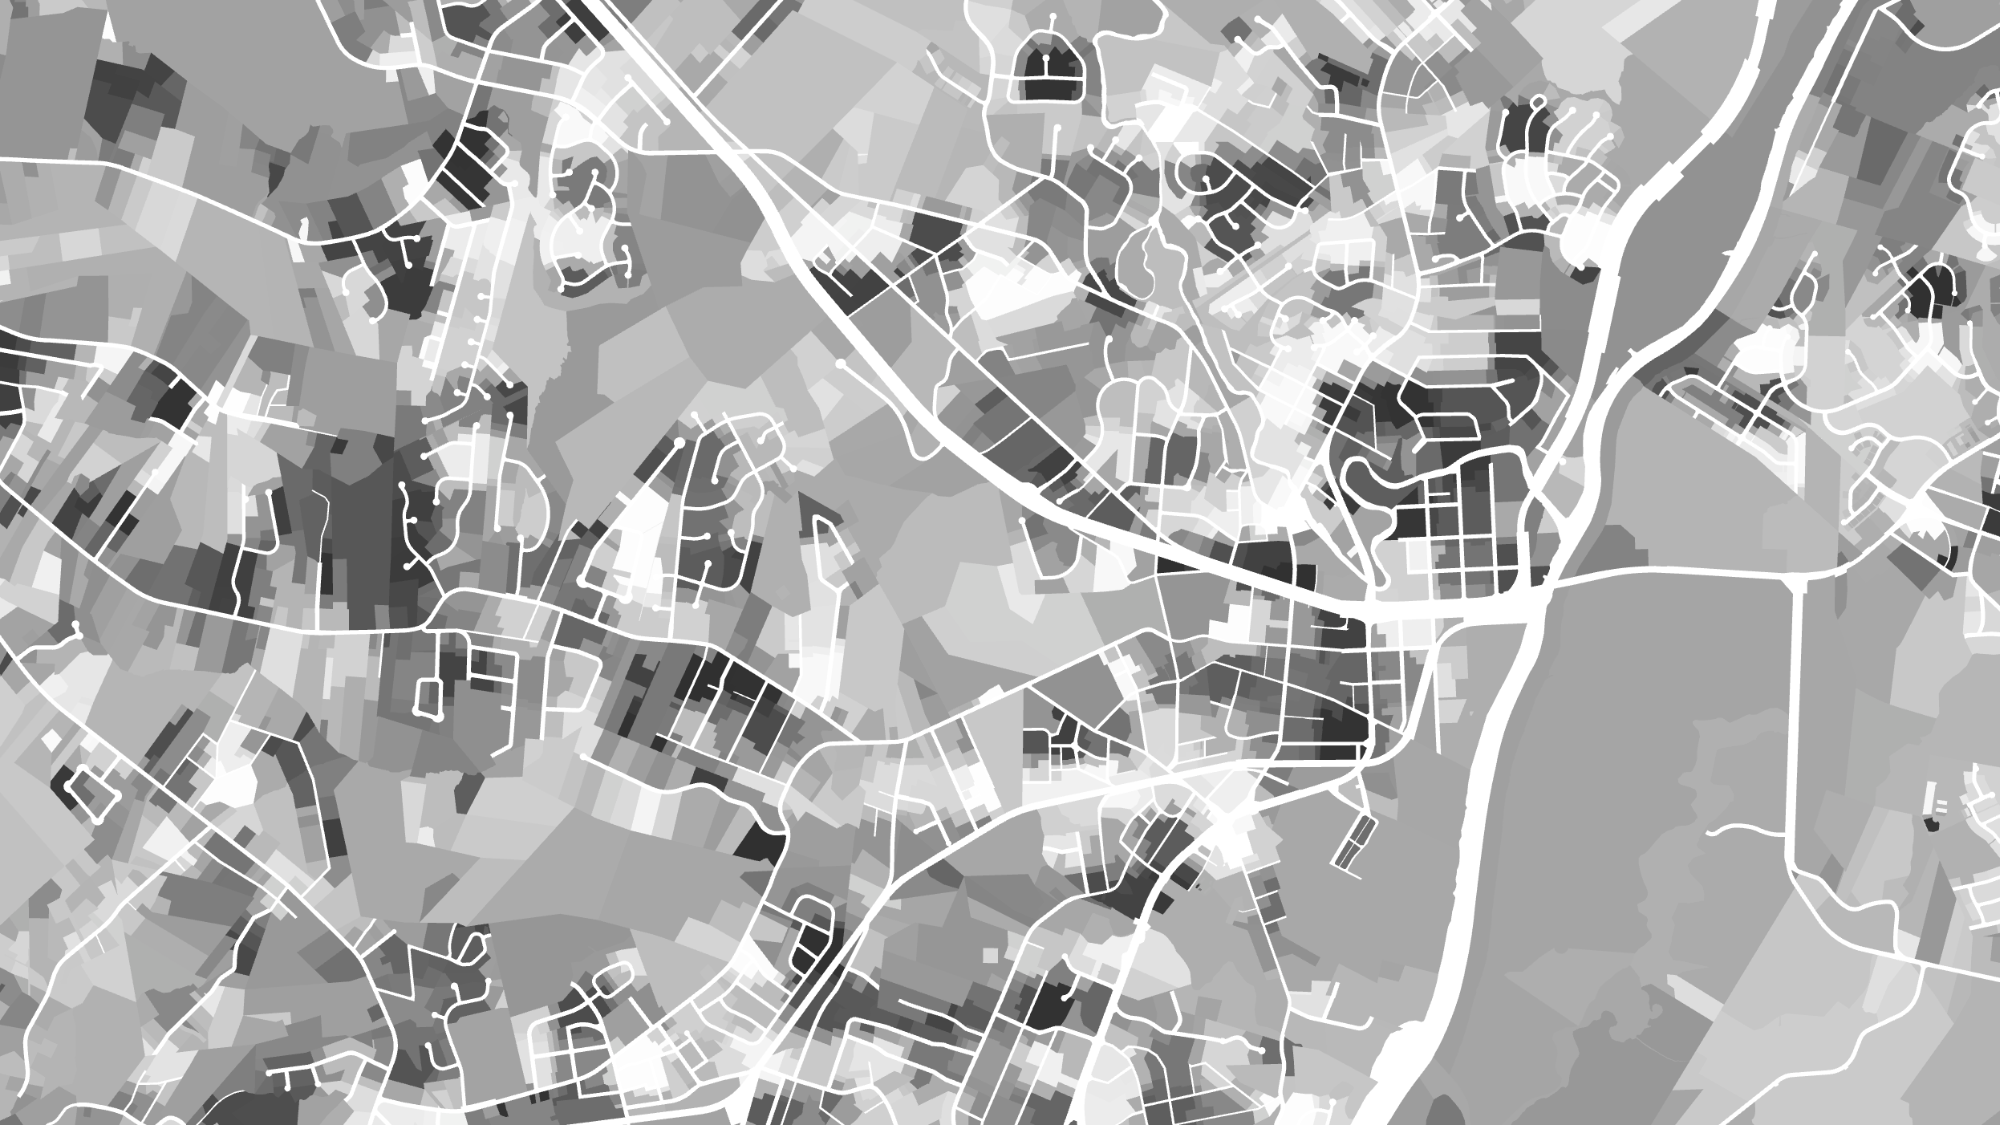
Parcel-level suitability analysis after a wildfire: each parcel shaded by composite suitability score (fire boundary intersection, tree cover loss, land ownership type, terrain characteristics). Darker = higher priority for reforestation outreach. Analysis run at individual parcel resolution across the full fire-affected area.
Impact
A lot of consulting engagements produce a deliverable and leave. This one was different: six months embedded with the team meant I understood the operational reality, not just the stated requirements. I saw what broke. I saw what the field crews actually asked for. I understood the data limitations well enough to design around them rather than pretend they didn't exist.
The tool that came out of that time wasn't built to spec. It was built to survive contact with the real workflow. That's a different kind of product.
Impact
A repeatable tool for every future fire event, not a one-time analysis.
Before: a GIS analyst spent days pulling together the same analysis for each new fire. After: the team ran the tool, got a ranked candidate list, and handed it to the outreach team the same day. The speed improvement wasn't the main thing. The repeatability was. The organization could now respond to new fire events with a consistent, reliable process instead of rebuilding from scratch each time.
The documentation and knowledge transfer ensured the team could adapt the tool as their work evolved: new data sources, new fire geographies, new parameters. They owned it.
Next project
The engineers had the data. The planners had the priorities. Nobody had connected them.
Green Infrastructure