Juliana McMillan-Wilhoit
Green Infrastructure · St. Louis Tabulae Spatial Services

The engineers had the data. The planners had the priorities. Nobody had connected them.

A green infrastructure company was prospecting for investment sites in St. Louis by driving around and eyeballing parcels on Google Earth. There were hundreds of thousands of parcels in the city and county. They needed a smarter way in. I calculated the permeability of every single one.

St. Louis, MO · City & County Green infrastructure company (via Tabulae Spatial) Lead analyst & product builder QGIS ArcGIS Online Semi-Automatic Classification Plugin NAIP Imagery Spatial Analysis Stormwater
Impact
Every parcel
Permeability calculated for every parcel in St. Louis city and county, individually
Google Earth → GIS
Replaced manual drive-by site visits with a filterable spatial database
1 app
Custom ArcGIS Online web application with CRM-style lead tracking built in
Days → clicks
Prospecting time cut from days of manual research to a filtered search

A green infrastructure company was planting trees, managing stormwater, and improving urban permeability. But to do that work, they needed to find the right parcels: the ones with poor drainage, the right ownership type, the right proximity to schools and roads. Their process for finding those parcels was to look at Google Earth and drive around. In a city with hundreds of thousands of parcels, that wasn't a process. It was a guess.

I started with listening sessions: sitting with the team, understanding their actual workflow, mapping what they needed to know about a parcel before they'd pursue it. Ownership type. Property classification. Distance to key features. And most important, permeability: how well could water actually infiltrate the soil?

That data didn't exist for St. Louis. I would have to create it.

Permeability data for individual parcels in St. Louis wasn't available anywhere. No dataset to download, no shortcut. So I used NAIP imagery (high-resolution aerial photography) and the Semi-Automatic Classification Plugin for QGIS to classify land cover across the entire city and county, distinguishing impervious surfaces (concrete, asphalt, buildings) from pervious ones (soil, grass, tree canopy) at the parcel level.

Then I matched those classifications to the parcel dataset, assigning each parcel a permeability profile. Hundreds of thousands of parcels. Every one calculated individually.

"The data they needed didn't exist. So I built it from aerial imagery, parcel by parcel, across the entire city."

With the permeability layer in hand, I built a complete prospecting system around it.
Permeability classification layer: NAIP imagery analyzed via Semi-Automatic Classification Plugin for QGIS, assigned to every parcel in St. Louis city and county
Parcel database: permeability data matched to ownership type, property classification, zoning, and other filterable attributes
Custom ArcGIS Online web application: enabled the client to filter and sort parcels by any combination of characteristics: ownership, property type, permeability score, proximity to schools, roads, and other features
Distance calculation tools: built-in proximity analysis so the client could instantly see how far any parcel was from target features
Site visit tracker: the app functioned as a lightweight CRM: the client could mark which parcels they'd visited, track lead status, and manage their prospecting pipeline spatially
Consensus workshop process: before building anything, I ran workshops to map the current process and the ideal process, so the tool matched how they actually worked
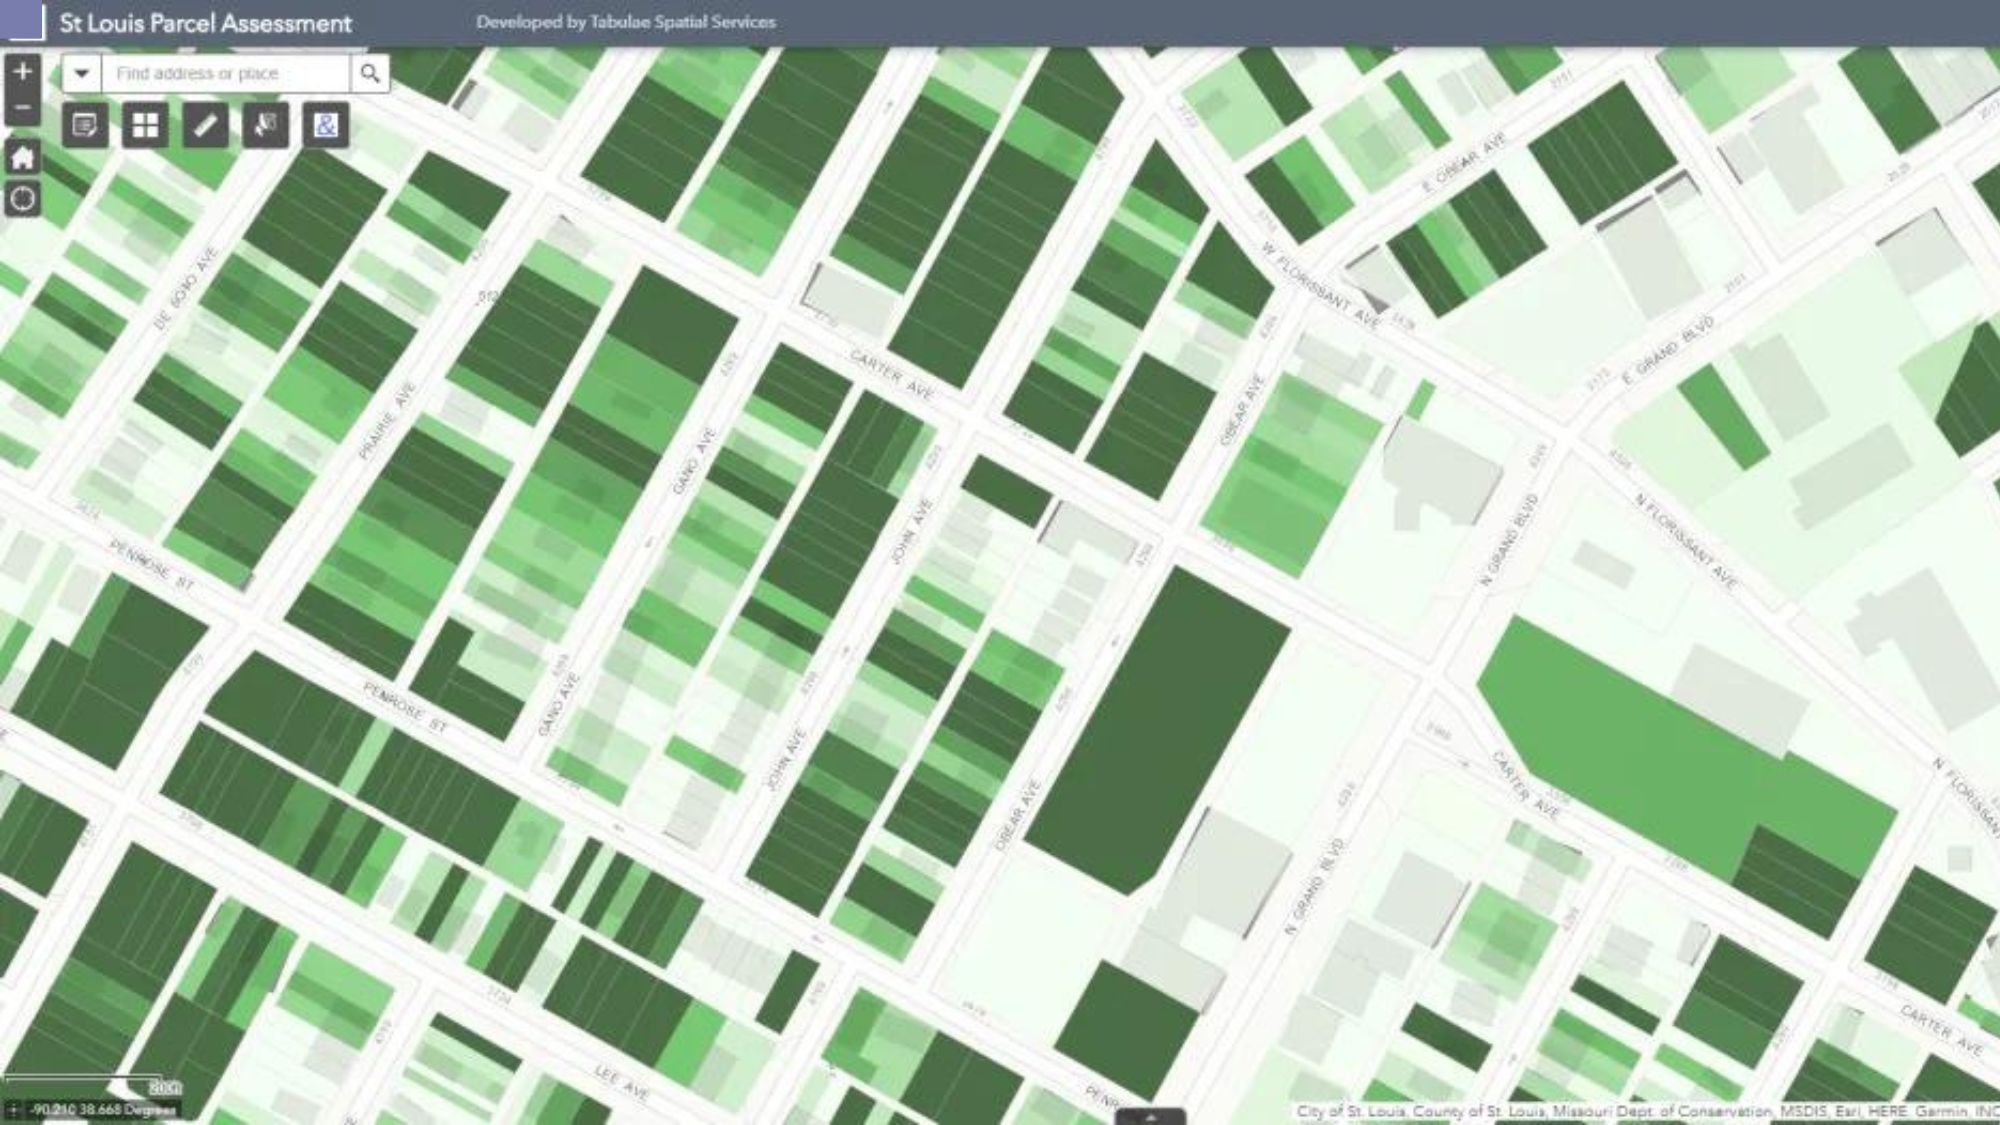
St. Louis Parcel Assessment web application showing parcels shaded by permeability score
St. Louis Parcel Assessment web application, developed by Tabulae Spatial Services. Each parcel shaded by permeability score; darker green = higher permeability = stronger investment candidate. The client could filter by ownership, property type, proximity, and more, then track site visits directly in the map.

Before this tool, finding a candidate parcel meant someone physically drove to a neighborhood, looked at it, and made a judgment call. After, the client could open the web app, apply filters (permeability above a threshold, ownership type, distance to a school under a mile), and get a ranked list of candidates in seconds.

The prospecting cycle that used to take days of field time was reduced to a few clicks. The tool also integrated with their CRM, so lead tracking and spatial analysis happened in the same place for the first time.

Impact
Replaced Google Earth and drive-bys with a filterable, spatial prospecting system.

The company could now work systematically through the city. Every parcel had a permeability score. Every parcel could be filtered, ranked, and tracked. The guesswork was gone.

What made this work wasn't just the technology. It was starting with the listening sessions. Understanding that the real problem wasn't "we need a map" but "we need to know which parcels are worth pursuing, and we need to be able to track what we've done." The tool solved that problem because we'd mapped the right problem first.

That's the pattern: go toward the people, find what they actually need, and build it.

Tools & Stack
QGIS Semi-Automatic Classification Plugin NAIP Imagery ArcGIS Online ArcGIS Web App Builder Spatial Analysis Land Cover Classification Consensus Workshop Methodology
Next project
County records were fine. Nobody could find them. A spatial index solved it.
Cemetery Mapping