Juliana McMillan-Wilhoit
03 Peapod Digital Labs (ADUSA Supply Chain Services) · Supply Chain · 2020–2023

The dashboard wasn't the problem. Nobody trusted the model behind it.

Everyone wanted a faster dashboard. I went and talked to the people who used it. Nobody trusted the outputs they were getting. The speed problem was real. But fixing it wouldn't have changed anything.

Peapod Digital Labs / ADUSA Supply Chain Remote Alteryx Tableau PCA Demand Forecasting
Impact
8h → 30m
Dashboard reporting time — routine reports
First
Validation the demand model had ever received
Block-group
Demand forecasting granularity — census block-group level
Multi-year
E-commerce facility network investment decisions set by model outputs

Consultants had built the model. The business had adopted it. Multi-million dollar e-commerce facility network decisions — where to build warehouses, which stores to use for fulfillment — ran on it. The presenting problem was dashboard speed: 8 hours to produce routine reports.

I went and talked to the people using the outputs. The real problem: they didn't trust the model. Not the speed. Not the format. The underlying conclusions. Esri consumer spending data looked like a strong predictor of e-commerce demand — until you asked whether it actually was. Nobody had. I ran PCA. It was the first validation the model had ever received.

"Multi-million dollar facility decisions. Made on a model. That nobody had ever stress-tested."

Before touching anything, I conducted user assessments and led focus groups to understand how the model was actually being used versus how it was supposed to be used. The gap was significant. People trusted outputs they didn't fully understand because there was nothing better.

The dashboard situation was the same story: ad-hoc requests, constant stress, no repeatable process. I ran interviews to understand what decisions people were actually trying to make — and built backward from there.

Once I understood the real problem, I worked on two fronts simultaneously: rebuild trust in the model, and make the reporting process something the team actually wanted to use.

Cleaned up the codebase: relative paths, proper date handling, updated model logic
Brought in new spatial data sources as better predictors of e-commerce demand than the originals
Ran PCA — the first validation the model had ever received — to build stakeholder confidence and expand adoption
Systematic dashboard process: SQL → Alteryx → Tableau, cut reporting time from 8 hours to 30 minutes
Set investment priorities for multi-year e-commerce facility network decisions
"I don't trust a dataset until I understand its limitations. Esri consumer spending data looks like a strong predictor of e-commerce demand — until you ask whether it actually is."
Example Alteryx workflow showing data pipeline logic

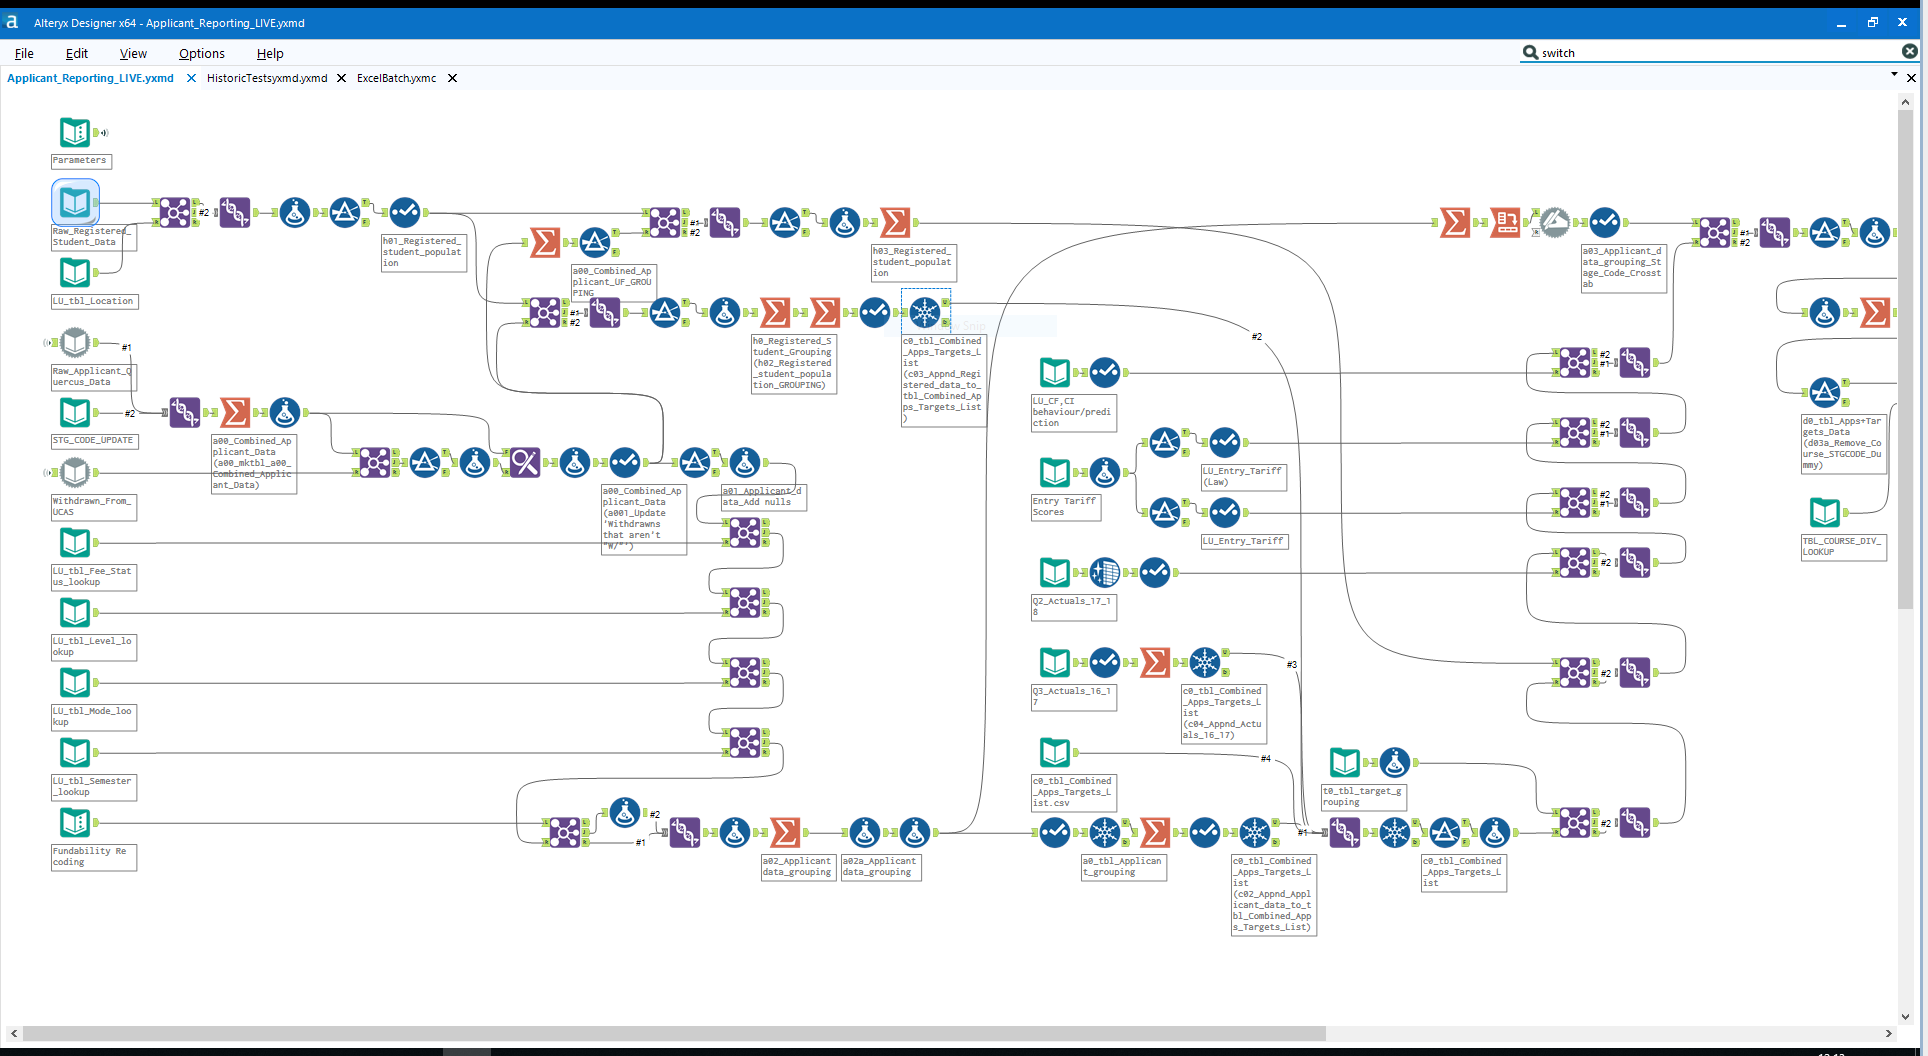
Note: Illustrative example of an Alteryx workflow. This is not the actual L-Trix workflow used at Peapod Digital Labs.

Impact
Stakeholders who had quietly doubted the outputs now had documented evidence they could trust.

The ad-hoc dashboard chaos became a repeatable, user-centric process that the team actually wanted to use.

The real change: multi-million dollar facility decisions started being made on a model that had actually been validated. That's not a small thing.

Tools & Stack
Alteryx Tableau Python SQL ArcGIS PCA / Validation
Next project
A small problem. Automated.
Library Automation